Get knowledge and insight
you can use
The GAIS report offers clear, actionable insights into current employee engagement levels and highlights areas where attention is needed. It presents in-depth engagement data in a simple, accessible format, empowering you to spark meaningful dialogue and drive informed action.
Track trends over time, monitor survey results, and stay updated on developments across your entire organisation—or within specific divisions and departments.
Follow trends
closely
No more waiting for analyses and reports!
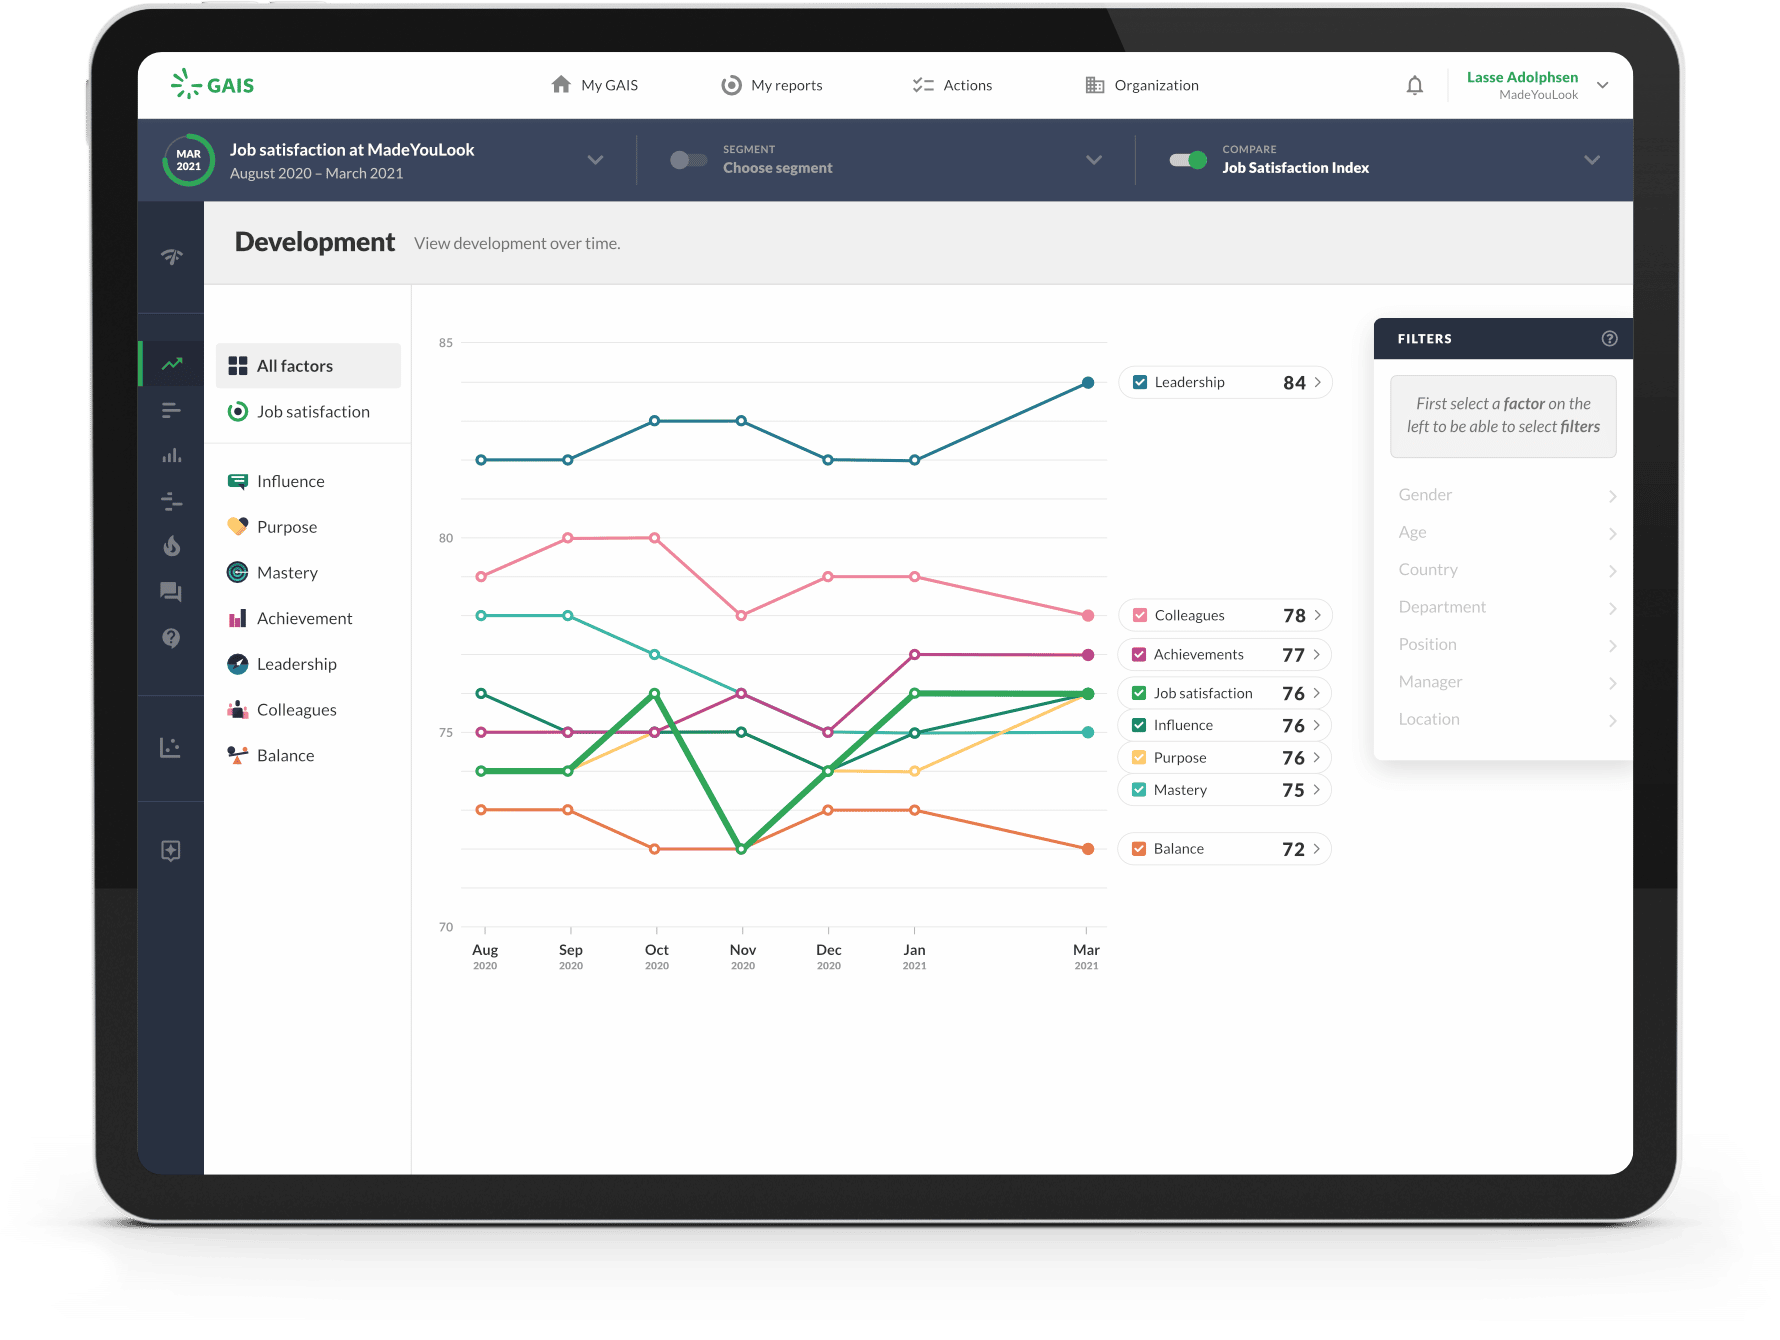
The full report is ready as soon as your survey is completed. Every time you run new surveys, the report is updated immediately with the new data. You can also monitor data in real time.
Multiple surveys in the same series make it easy to follow trends over time. Graphic presentations make trends easy to follow, and help you prevent and take the right action at the right time.
Use GAIS in your employer branding to attract and retain skilled employees.
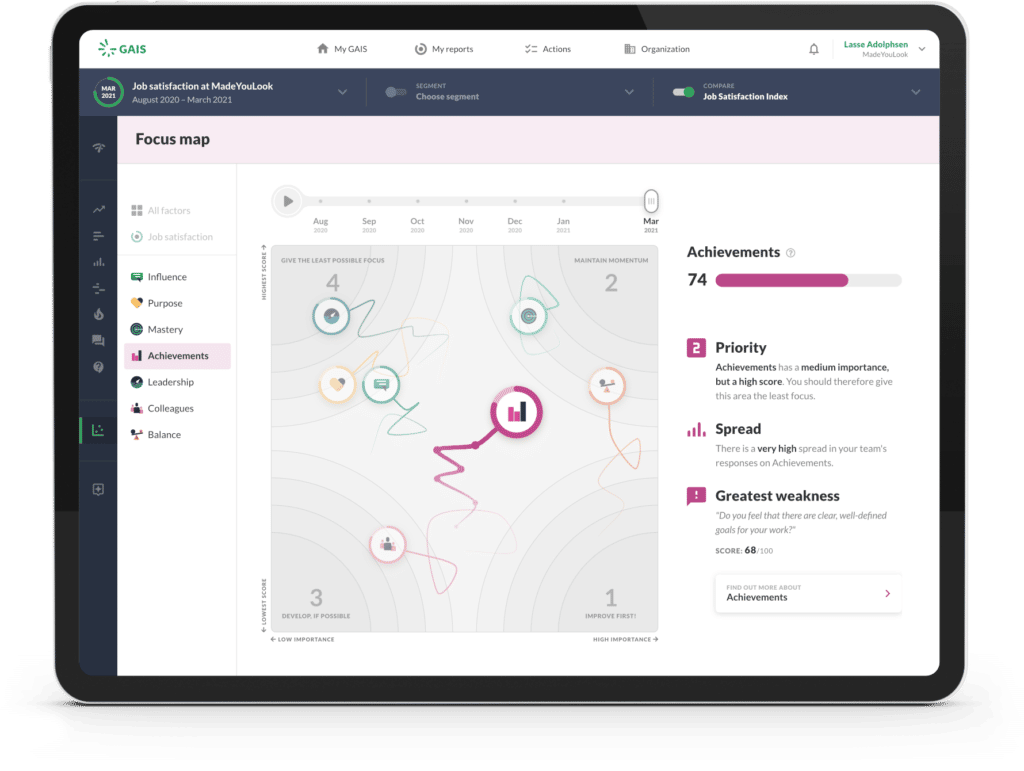
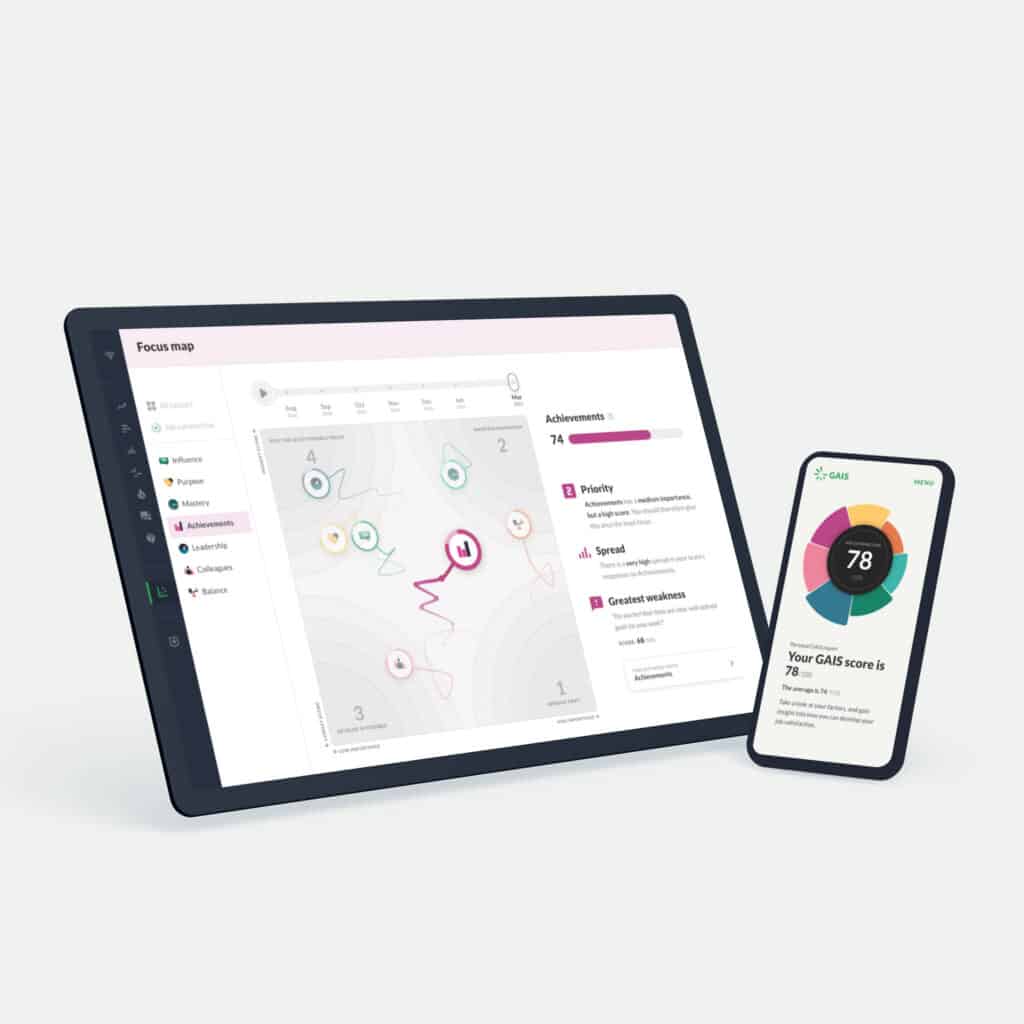
Focus map: See your potential and problem areas
Our ‘focus map’ helps you prioritise the right areas. A graphic presentation links importance and scores to make it clear where you can achieve maximum effect by concentrating your efforts. The focus card is a great way to start analysing data.
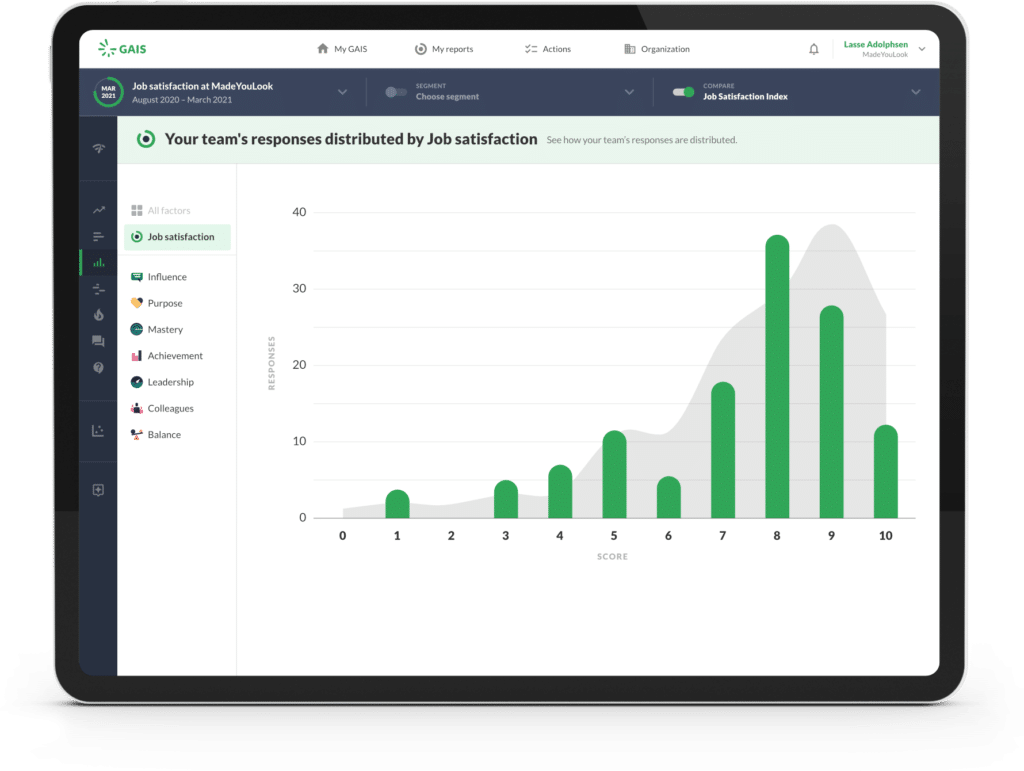
Spread: Visualise your level of cohesion
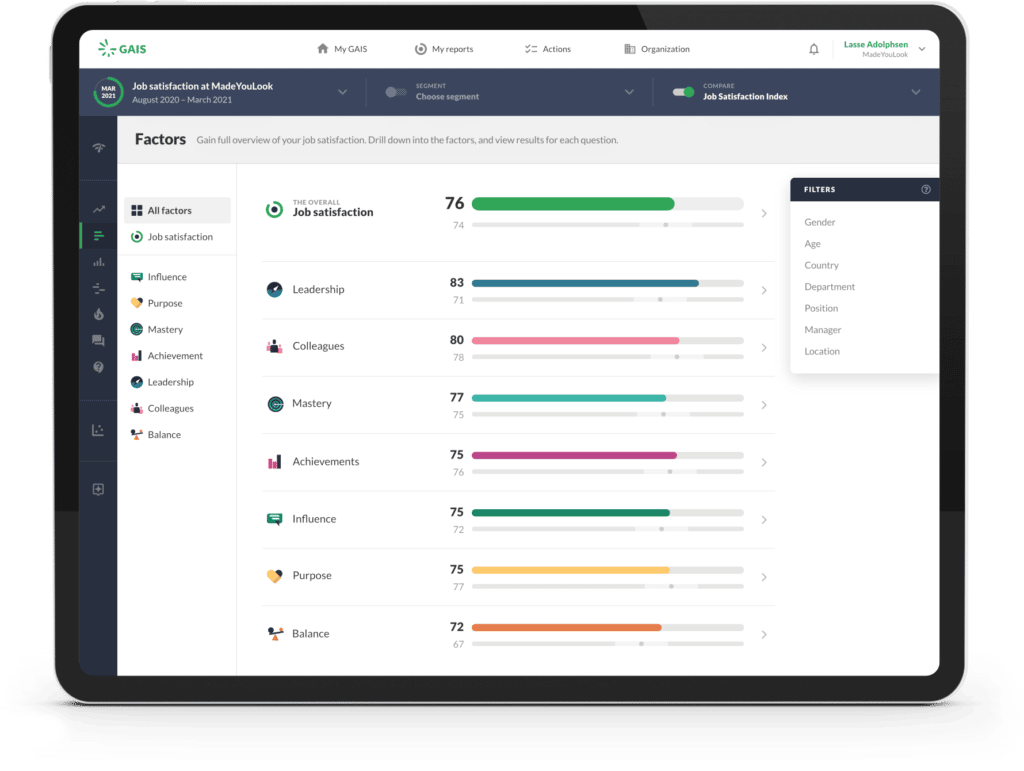
Factors: Dive deep into data
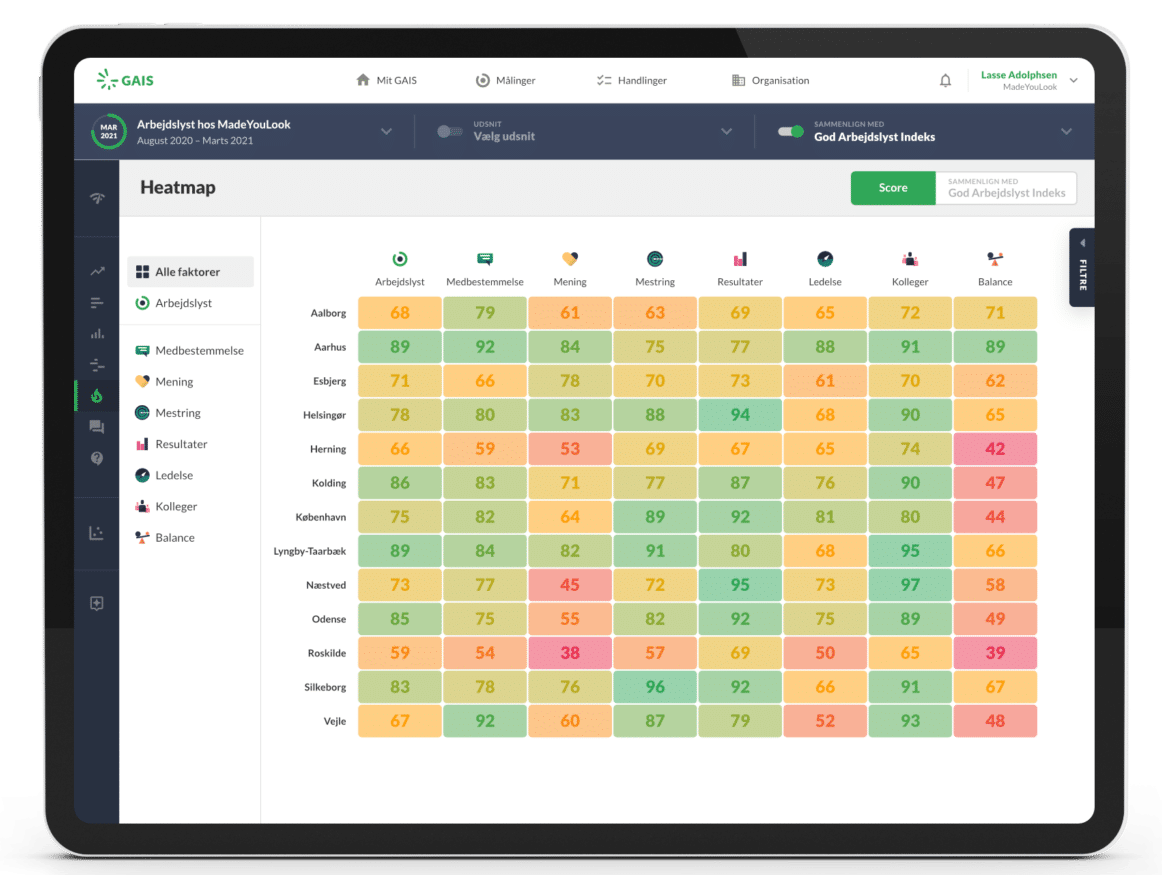
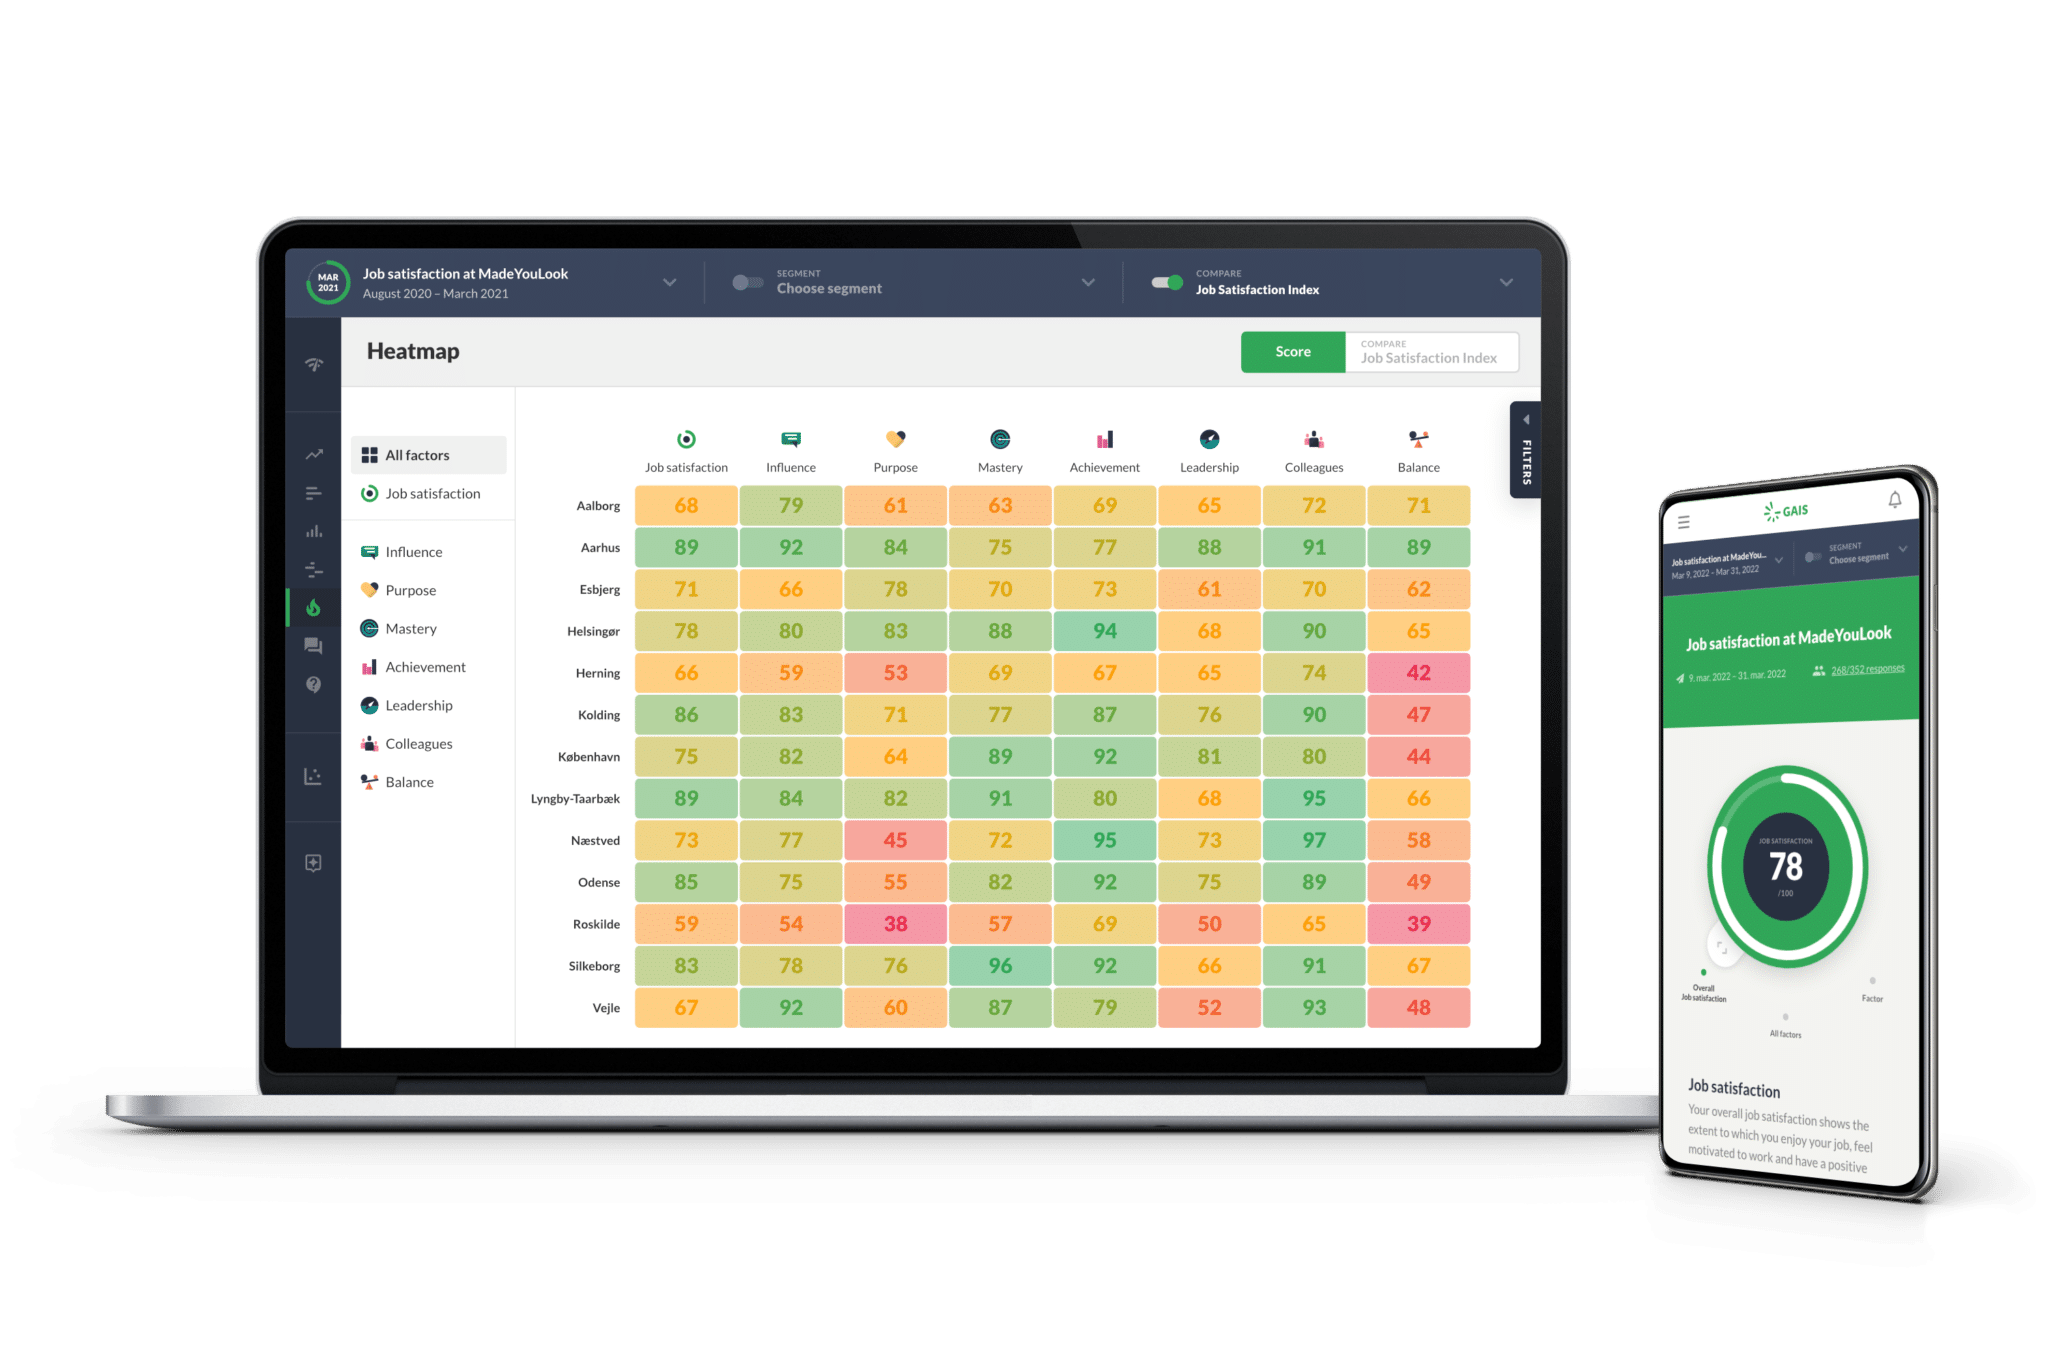
Heatmap: Get the big overview
With GAIS Heatmap, you can easily get a large, fast and visual overview of the results of a survey. The heatmap shows in one image all factors combined with e.g. all departments. All filters can be used for comparison.
It is possible to choose a benchmark to compare directly in the heatmap, and then you can easily create actions directly from the numbers that catch your eye.

Capture the nuances
with AI sentiment analysis
Participants’ free-text comments complement the numbers in the report. Get an overview of the comments with AI content analysis and various sorting features.
Comparing with
various benchmarks
Follow the development of your employee engagement and work environment – and directly compare it with the development in your industry. Benchmark against sub-reports or the entire company’s results.
Live Benchmark with up-to-date data and the opportunity to compare with your industry.
Full flexibility
when working with data
You get full flexibility when analysing your data.
- Group, combine and compare data across departments, groups and locations, for instance.
- Generate all the segment reports you want, and give access to relevant personnel in the organisation.
- Create actions on the knowledge you gain from your survey

Easy to share - easy to present
It’s easy to share and present insights from GAIS.

Presentations
Download the whole report or segment reports in PDF or PowerPoint.
Data files
Download all report results and free text comments in CSV formats.

Sharing
Share reports in digital or print-friendly formats with everyone relevant.
I’d like to hear more about GAIS
Create actions
from your survey results
With insights and data from your survey, you can create actions in GAIS.
You can create actions from any survey, eg. WRA, leadership survey etc.
GAIS Actions makes it easy to initiate, follow up on and create an overview of actions and measures.